What is Exploratory Data Analysis? Why Do We Use It?

###

###
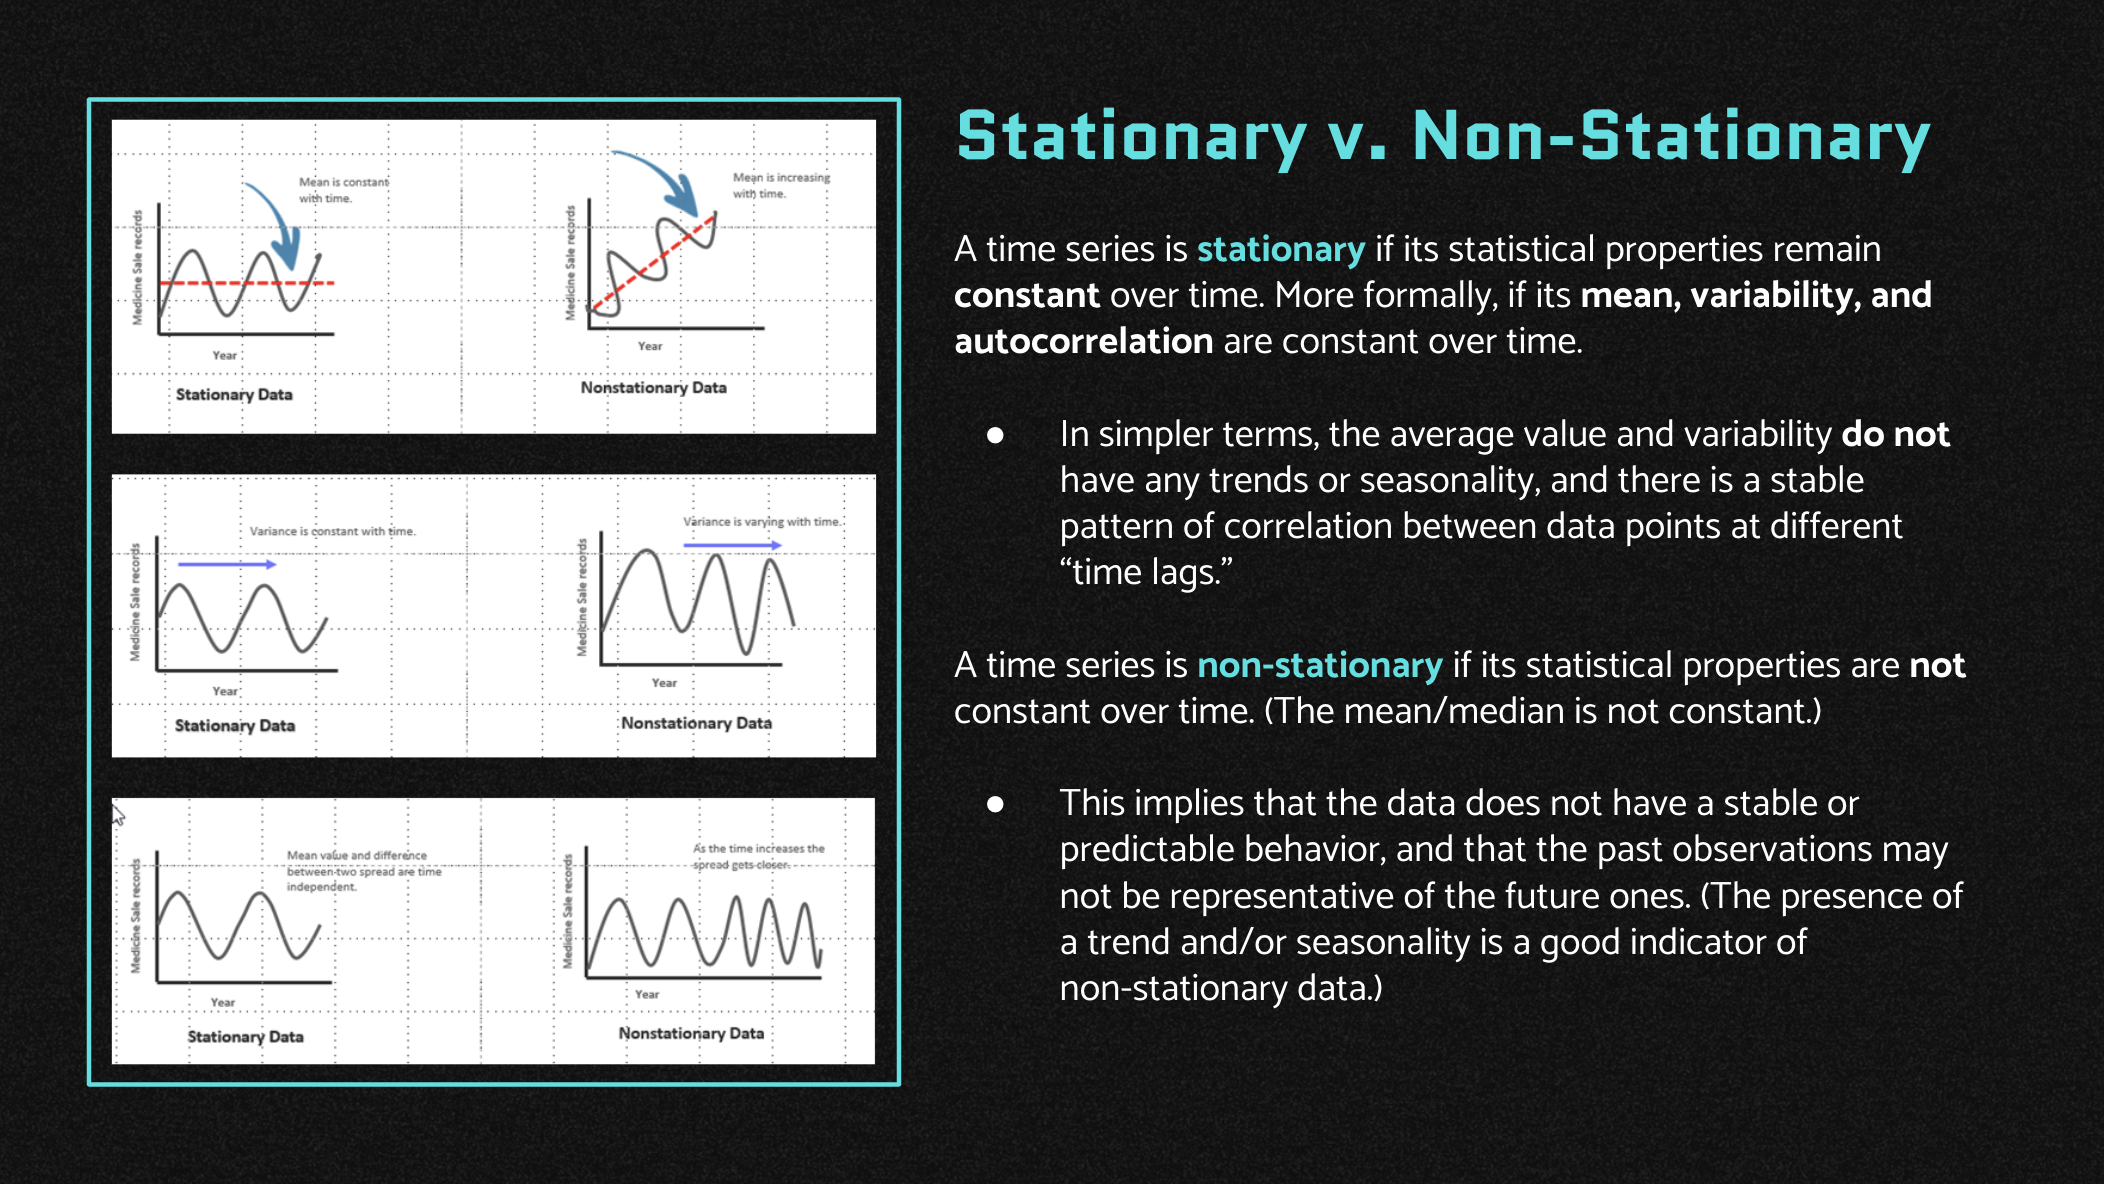
What is Stationarity?

###
Mini Lab #2: Testing for Stationarity
-
Convert global temperature data from monthly to annual to reduce the noise and then plot it.
-
What can you observe from this new plot?
-
Do you hypothesize that this data is stationary or non-stationary?
-
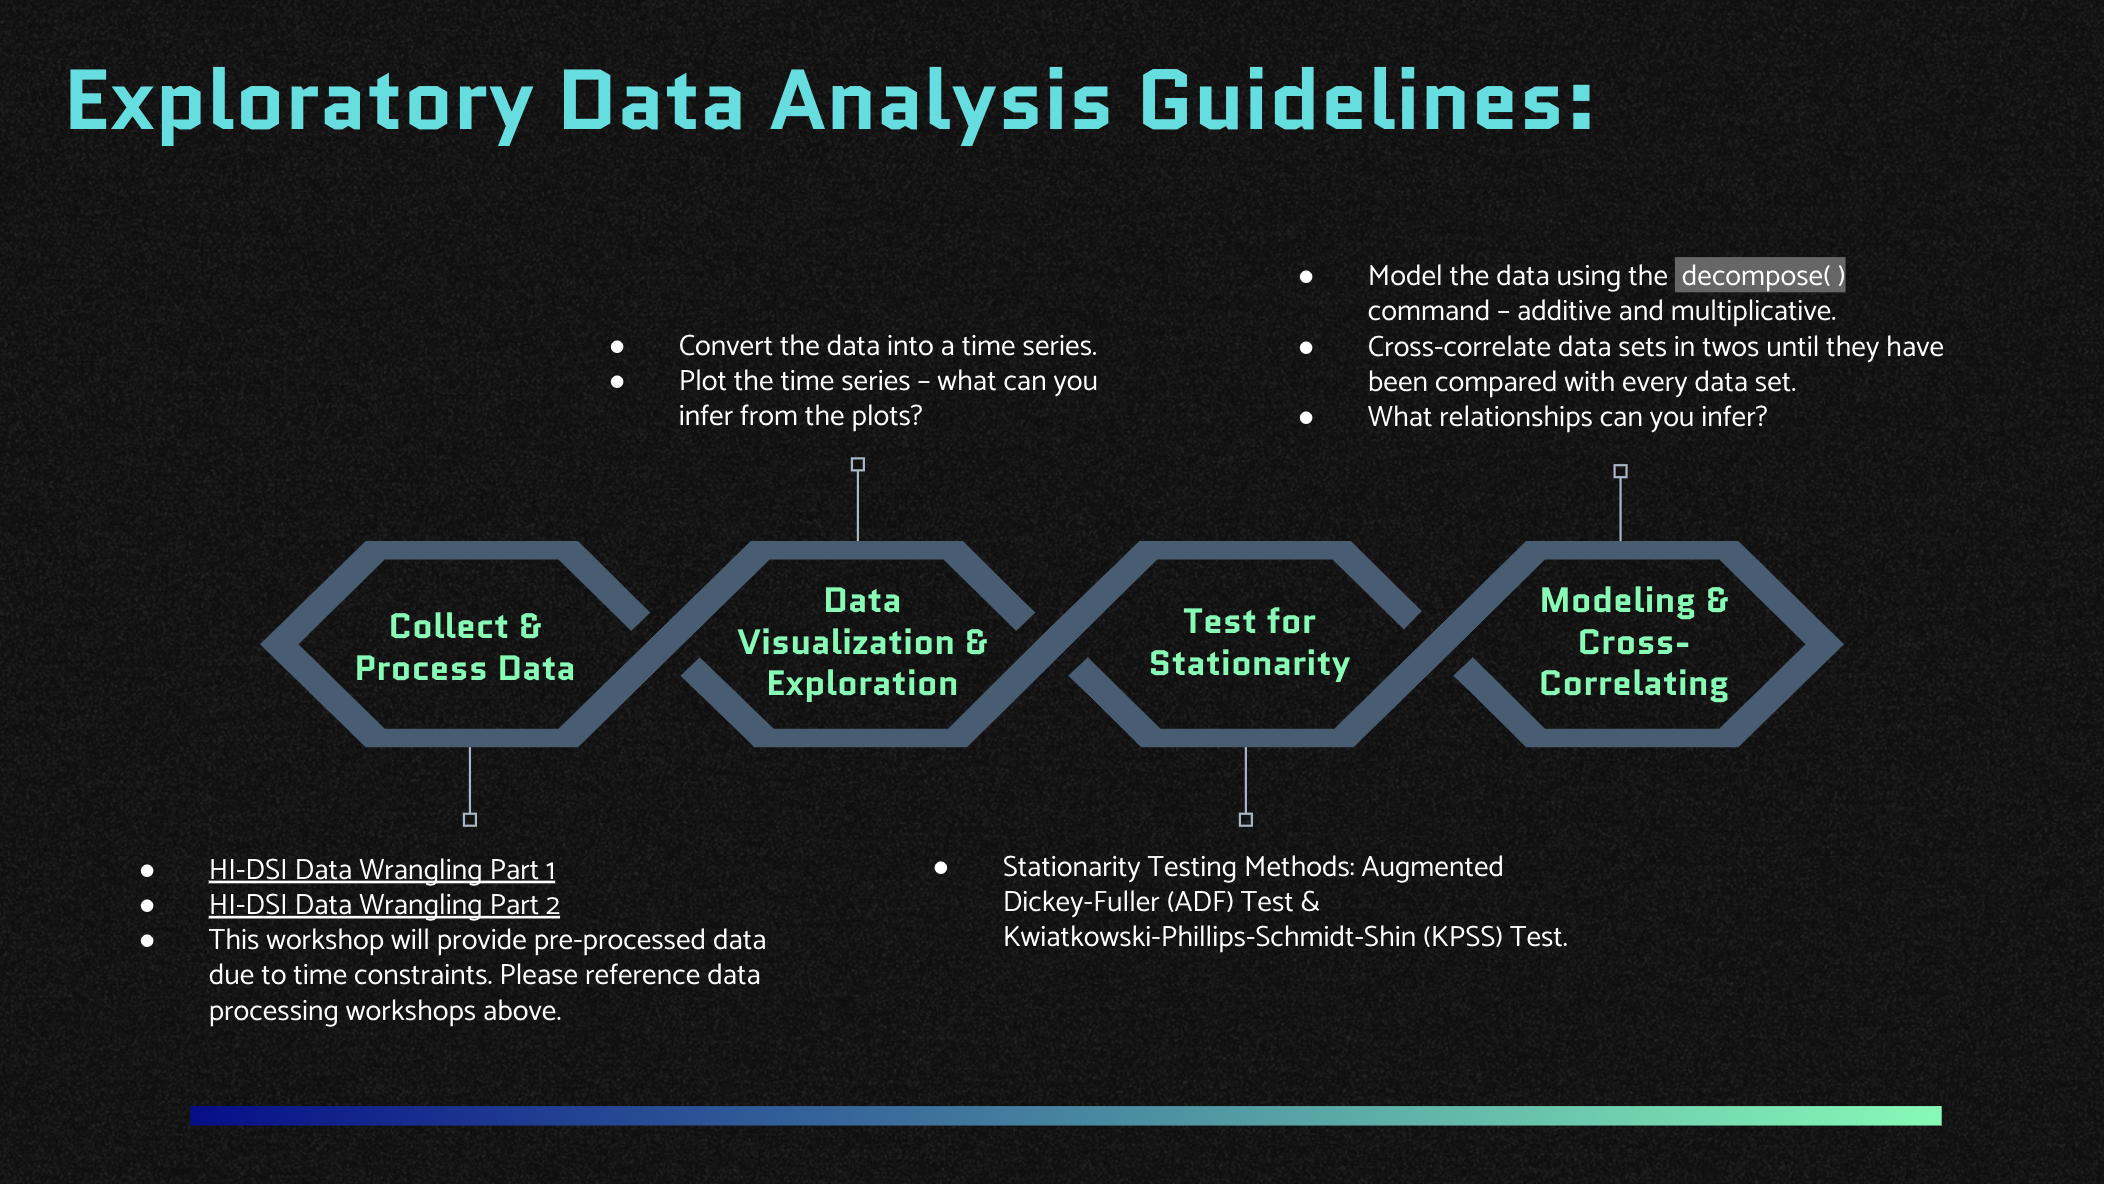
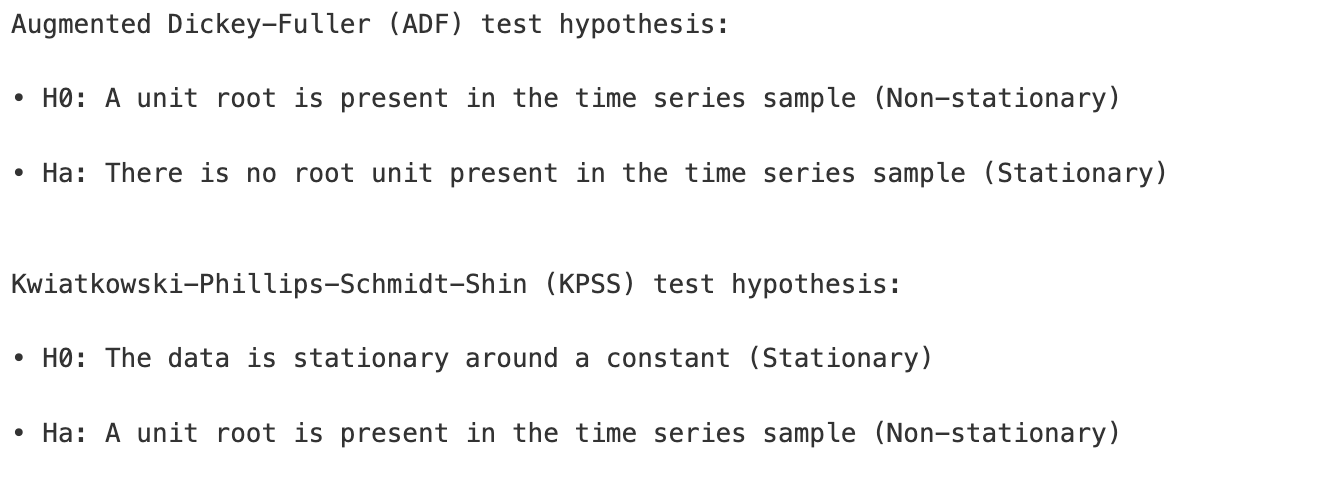
Test for stationarity using two common methods (using the annual global temperature data):

-
adf.test(annual_data)
-
kpss.test(annual_data)
-
-
What do the p-values indicate? How confident are we?
-
Now go back in time until the data interval seems stationary. Start with data 1940 and prior and work your way back until you are highly confident in stationarity.
-
adf.test(annual_data[time(annual_data) < \Dec 1940])
-
kpss.test(annual_data[time(annual_data) < \Dec 1940])
-
-
What can you deduce from this stationarity analysis?